


Grab this free resource:
Acquisition Buyout Calculator
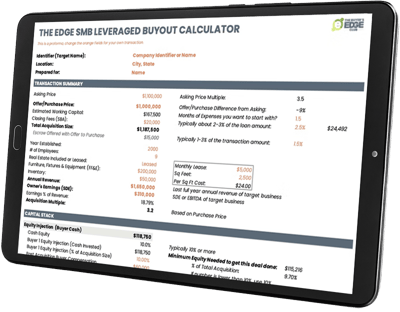
This Excel tool helps you engineer a bank-friendly capital stack for an acquisition. You enter a few deal assumptions (price, working capital, fees, cash flow, and proposed funding mix), and the sheet calculates: the total acquisition size, how much bank/SBA debt the business can support at the target Debt Service Coverage (DSC), your total debt service (monthly/annual), expected ROI on your cash, and the buyer’s take-home “Total Cash Flow to Buyer after Debt Service.” Edit only the orange cells; everything else updates automatically.

How to use it (step-by-step)
-
 Set the basics (top-left header)
Fill in Identifier/Target Name, Location, and Prepared For. These are just labels for your scenario.
-
Complete the Transaction Summary (left column)
Enter the orange fields to define the deal:
-
Asking Price and your Offer/Purchase Price (the sheet shows the difference and multiples).
-
Estimated Working Capital using the “Months of Expenses you want to start with” input—this rolls into Total Acquisition Size.
-
Closing Fees (SBA) — you can input a dollar amount or use the note showing that fees are typically ~2–3% of the loan; the % helper is shown on the sheet.
-
Escrow/Deposit — enter your proposed earnest money (the sheet notes a typical 1–3% range).
-
Operating facts (Year Established, Employees, Lease/RE terms, FF&E, Inventory).
-
Annual Revenue and Owner’s Earnings (SDE/EBITDA) — this drives cash-flow outputs later.
-
-
Build your Capital Stack (middle section)
The goal is to fill the total acquisition cost 100% with some mix of buyer cash, (optional) investor equity, SBA/bank debt, and a seller note. Use these orange inputs:
-
Buyer Cash (Equity Injection) — usually ≥10% of Total Acquisition Size. The sheet shows “Minimum Equity needed to get this deal done.”
-
Post-Acquisition Buyer Compensation — enter your planned salary/draw so the model reflects realistic owner earnings (the sheet notes a minimum guideline if your number is too low).
-
Investor Equity (optional) — add if partners will contribute cash.
-
SBA/Bank Loan — set Interest Rate and Amortization (years). The model displays Max SBA/Bank Debt Supported so you know your debt ceiling for bank underwriting.
-
Seller Note — amount, interest rate, and amortization (often shorter than SBA).
Watch the Balance line at the bottom of this section — it must read $0 and 100%; otherwise your stack doesn’t add up.
-
-
Check bankability & cash flow (bottom section)
-
Confirm Cash Flow Available for Debt Service (EBITDA) reflects normalized, lender-ready cash flow for the target.
-
Review Total Monthly/Annual Debt Service (SBA + Seller Note).
-
Make sure Debt Service Coverage (DSC) meets or exceeds the Target DSC shown on the sheet (1.35 in the example). If DSC is low, reduce debt, lengthen amortization (if allowed), lower interest, increase equity, or increase seller note (with longer term).
-
Validate Max SBA/Bank Debt Supported is ≥ your actual SBA/Bank loan amount.
-
Review your take-home: Total Cash Flow to Buyer after Debt Service (owner’s earnings minus annual debt service).
-
Check Cash Investment ROI (roughly: Buyer’s post-debt cash flow ÷ Buyer Cash Equity).
-
-
Iterate until it passes underwriting math
Keep tweaking the orange inputs in the Capital Stack until all of these are true:
-
Balance = $0 and 100% (the stack fully funds the deal).
-
DSC ≥ Target DSC (meets bank cash-flow guidelines).
-
SBA Loan ≤ Max SBA/Bank Debt Supported (you’re under the modeled lending cap).
-
Buyer Cash Flow after Debt Service is acceptable for your goals and risk.
-
-
Use the outputs to guide your offer & talks
The multiples, DSC, buyer cash flow, and minimum equity needed help you shape an LOI structure (price, working capital ask, seller note size/terms, and your equity injection) that is both attractive and financeable. The sheet also shows typical ranges (e.g., closing fees ≈2–3%, escrow 1–3%) to keep your assumptions realistic.
Formula quick reference (what the key numbers mean)
-
DSC = EBITDA (cash flow available for debt service) ÷ Total Annual Debt Service.
-
Max SBA/Bank Debt Supported = the maximum loan such that DSC stays at/above the sheet’s target.
-
Total Cash Flow to Buyer after Debt Service = Owner’s Earnings − Total Annual Debt Service.
-
Cash Investment ROI ≈ (Buyer Cash Flow after Debt Service) ÷ (Buyer Cash Equity).
Tip: The orange-cell rule, the Balance line, the DSC target (1.35 shown), and the typical fee/escrow ranges are all visible on page 1 of the sheet. Use them as a checklist while you iterate scenarios.
Educational note: The calculator is an informational tool to help you structure deals and talk to lenders; always validate numbers with your lender, CPA, and counsel before you rely on them.
